
Tips and tricks for successful Mass spec experiments
Troubleshooting guide to address the most common obstacles during mass spectrometry experiments.
Mass spectrometry is a popular method in basic and advanced drug discovery research. The range of applications is broad, from compound identification in simple mixtures to the analysis of more complex sample sets, i.e., proteomics.
Proteome and Proteomics
The proteome encompasses all proteins within an organism. Proteomics entails the study of the dynamics of the proteome under environmental influences, intrinsic changes (e.g., differentiation or cell death), cell type, cell compartment, or cell cycle stage (1).
Proteome studies using mass spec can reveal alterations in protein abundance, isoform, or modification (ubiquitination, sumoylation, phosphorylation). In vivo protein crosslinking (with cleavable or non-cleavable crosslinkers) can give a detailed insight into specific protein-protein interactions, which were previously only addressed by systematic mutation and hybridisation studies (2,3).
MASS spec offers new opportunities to answer many biological questions. However, the sensitivity and complexity of modern mass spec methods demand careful sample preparation and data analysis.
A few considerations before starting a mass spectrometry experiment:
- What is the biological question behind my experiment, and how likely is it that mass spec can help with answering it?
- What type of sample am I working with?
- How abundant is (are) my protein(s) of interest, and how easily can it (they) be detected?
- How stable are protein modifications, and how can I avoid protein degradation?
- How do I avoid sample contaminations that interfere with detection (e.g., keratin, polymers)?
- What controls do I need to include in my experiment?
- Which enzyme and digestion type should I select to obtain perfect-sized peptide fragments for detection?
- What type of software should I use for my analysis?
4 essential parameters for the mass spec data analysis:
A. Intensity:
The intensity is a direct measure of how abundant a single peptide is, i.e., how often it is detected. This value is influenced by the abundance of the original protein, as well as the peptide size and its ability to “fly.” Note: not all peptides “fly” in the mass spectrometer; if peptides fail to ionize or the ions are too unstable and fragmentate, they can fail detection.
B. Peptide count:
This is the number of different detected peptides derived from the same protein. A low peptide count means either low abundance of the protein or suboptimal size for peptide detection (either too small or too big). In this case, a higher or lower digestion time or an alternative enzyme should be considered.
C. Coverage:
The coverage is directly related to the peptide count and refers to the proportion of the protein covered by the detected peptides. A good level of coverage is between 40 and 80% in less complex samples (mainly when dealing with purified proteins); it depends on the number of enzyme recognition sites and peptide lengths after digestion. In more complex proteome samples, coverage of a protein ranges between 1 and 10%, which is enough for identification.
D. P-value/ Q-value/ Score:
The peptide result/identification needs to be verified by statistical significance analysis. Depending on the software used, this is indicated by the P-value/Q-value or Score and should be < 0.05. P-value: the chance that the peptide identification is a “false positive.” Q-value: P-value, additionally adjusted to the FDR (False Discovery Rate = the probability of a signal showing as significant, even though it is not). Score (Mascot): the probability that the peptide identification is a random event.
Mass Spectrometry troubleshooting
Q: Was the protein expressed in my sample?
A: Check your input sample (i.e., directly after cell harvesting) by Western Blot.
Q: Was the protein lost during the experimental procedure, i.e., during sample processing?
A: It should be routine to take a sample at each experimental step to ensure the protein is the sample (verification by Western Blot).
Q: Was the protein degraded during the sample processing step?
A: For different reasons, some proteins are sensitive to degradation. It is recommended that additional protease inhibitor cocktails (active against a broad range of aspartic, serine, and cysteine proteases) are added to all your buffers during the sample preparation step (please ensure they are removed before trypsin treatment!). Use EDTA-free cocktails; PMSF is recommended.
Q: Was a significant amount of sample lost during the experimental steps?
A: Low-abundant proteins can easily be lost during the sample preparation step or cannot be detected next to proteins with high abundance. Scale up the experiment, increase the relative protein concentration using a cell fractionation protocol, or enrich low-abundant proteins by IP.
Q: What if “peptides escape detection”?
A: Unsuitable peptide sizes (either too long or too short for detection) can result from a lack/abundance of protease recognition sites within the protein sequence, or over-/under-digestion of the protein sample. Change the digestion time or protease type. Double digestion is also an option (a combination of two different proteases).
5 Top Tips
TIP 1:
Before starting the experiment: CHECK THE ABUNDANCE, REGULATION, and EXPRESSION PROFILE OF THE PROTEIN. For proteomic datasets: check cell cycle regulation and cell line characteristics (e.g., cancer cell lines usually have disrupted transcriptional regulation or signal pathways to allow “unregulated” growth).
TIP 2:
USE filter tips, single-use pipettes, and HPLC grade water. AVOID AUTOCLAVING of plastics and solutions as well as the use of washing detergents to clean glassware!
TIP 3:
CHECK THE COMPATIBILITY OF ALL BUFFER COMPONENTS; include protease inhibitors, detergents, EDTA, and reducing agents; check the salt concentration and pH of the buffer.
TIP 4:
KEEP all your PROTEIN SAMPLES AT A LOW TEMPERATURE (4°C working/ -20°C to -80°C storage conditions).
TIP 5:
Always MONITOR EACH STEP OF YOUR EXPERIMENT by Western blot/Coomassie staining.
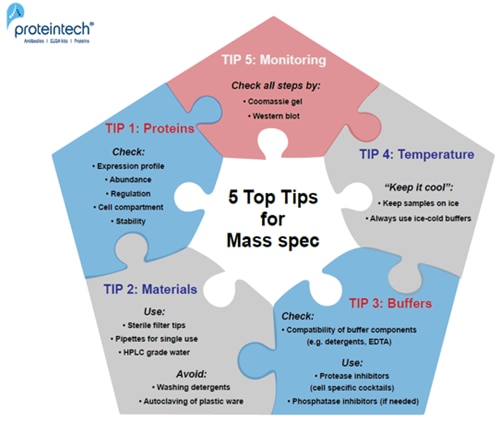
Fig. 1. 5 Top Tips for successful Mass Spec experiments.
References
3. Paramelle et al (2013) “Chemical cross-linkers for protein structure studies by mass spectrometry”
Related Content
Mass spec-compatible immunoprecipiation for GFP, mNeonGreen, Myc, RFP, Spot, and TurboGFP
GFP (green fluorescent protein): Properties, origin, specifications, tips
New anti-mNeonGreen antibody & Nano-Trap for Immunofluorescence & Immunoprecipitation
The best anti-GFP antibody for immunoprecipitation: GFP-Trap
What GFP-Trap should I use for my immunoprecipitation?
Green fluorescent protein (GFP) in plant research
GFP-Booster: GFP Nanobody for better images in immunofluorescence
GFP and RFP-Booster for better immunofluorescence imaging
GFP- Nanobodies and RFP- Nanobodies conjugated to quantum dots
Learn how to save precious hours on your IP, IF, and western blotting experiments

Support
Newsletter Signup
Stay up-to-date with our latest news and events. New to Proteintech? Get 10% off your first order when you sign up.
Able™