
How to Identify Activated Microglia
Proteintech experts share ways to quantify your microglial cell population
What are microglia?
Microglia are the resident immune cells of the central nervous system (CNS) and are key players in brain homeostasis. They account for about 10–15% of the cells found in the brain. In contrast with many other CNS cells, microglia originate from yolk sac erythromyeloid precursors and then migrate to the CNS during early embryonic development. Microglia have become a hot topic for research as we continue to learn more about their biological roles in development and disease, their heterogenous makeup, and their ability to communicate with the gut microbiome.
How are microglia activated?
Microglia are highly dynamic cells that undergo distinct morphological changes during activation. During baseline surveillance, microglia exhibit a ramified appearance and extend and retract their processes in order to monitor their environment. Microglia can become primed in response to bidirectional communication with other cells or in the presence of pathogens, injury, or other stressors. During the early stages of activation, microglia can become hyper-ramified where they undergo elongation of their processes and increase branch complexity. This is thought to be an intermediate step to microglial activation or a mild response to non-threatening stimuli. The next steps in activation and morphological change result in microglia retracting and thickening their processes. During this time microglia begin to release certain molecules, including pro-inflammatory or anti-inflammatory cytokines. Finally, when microglia are fully activated, they take on an amoeboid shape and begin to play a role in phagocytosis (Fig. 1).
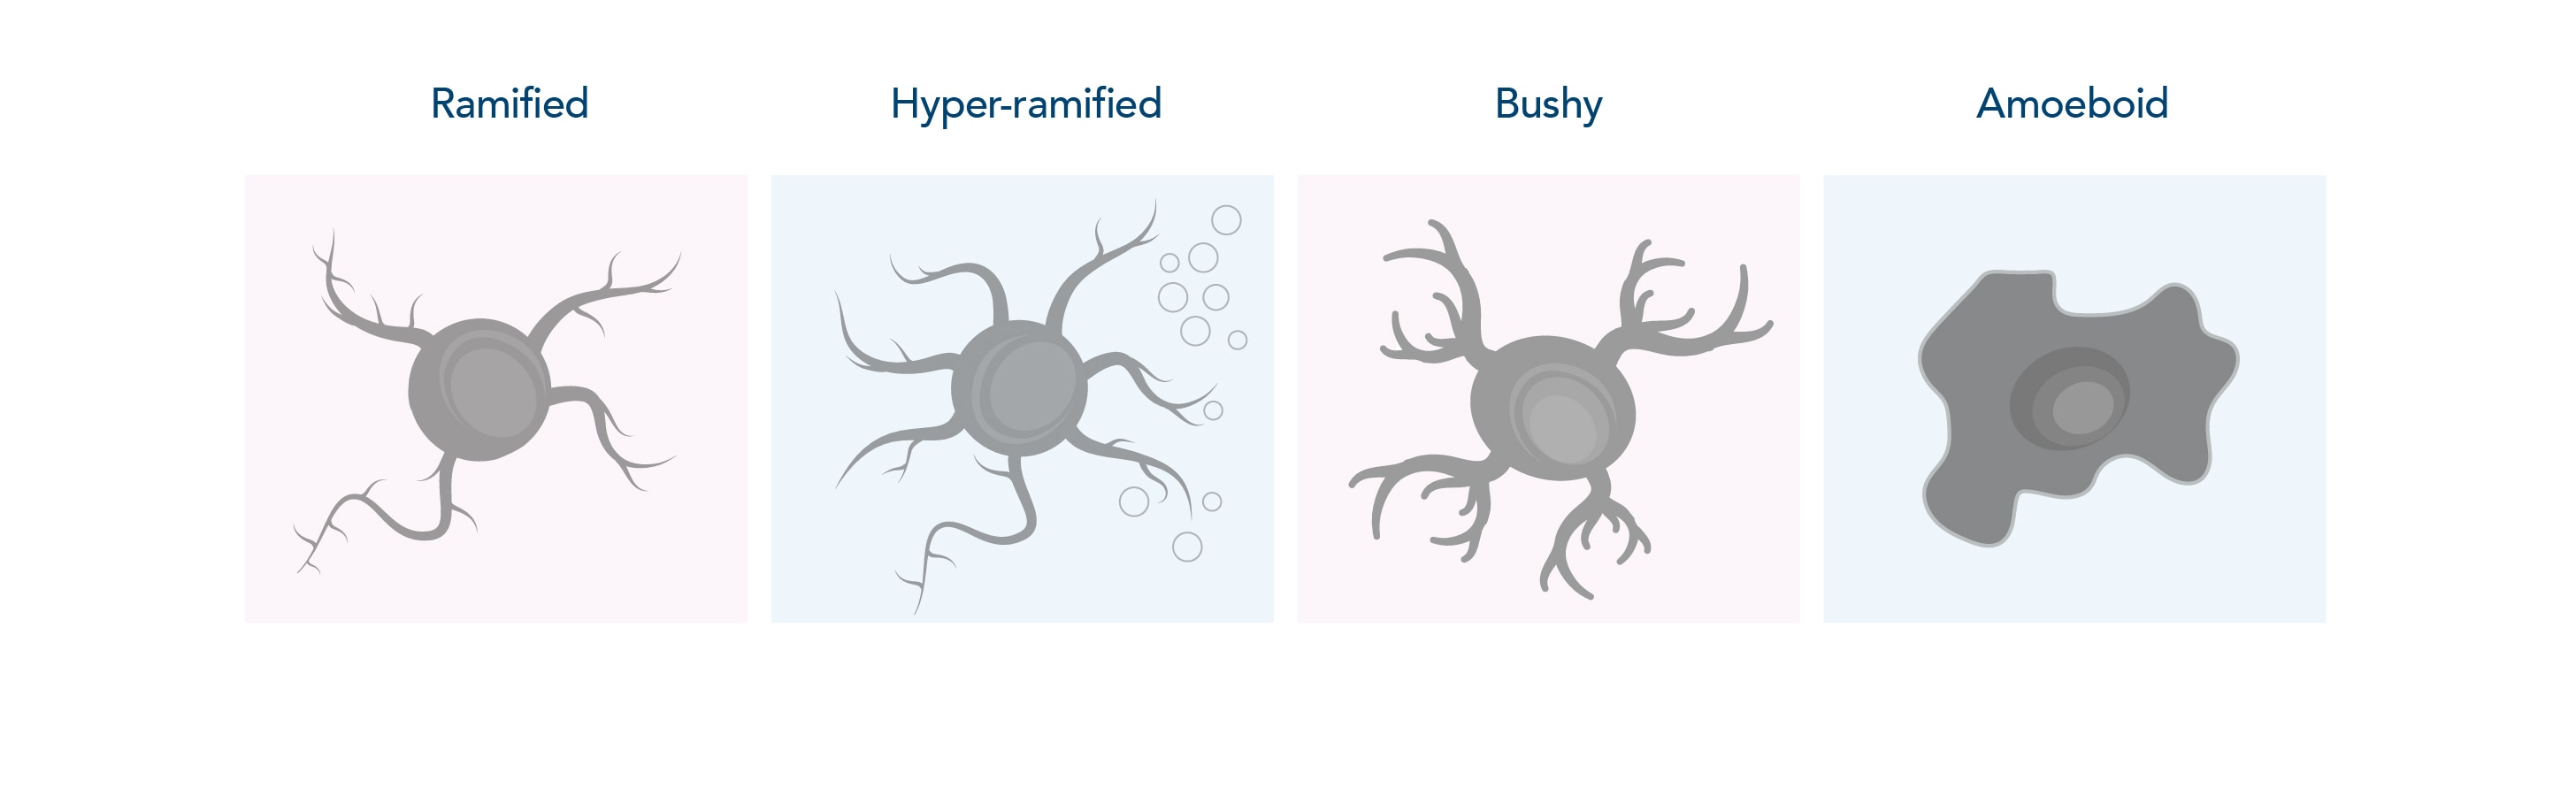
Fig. 1. Microglial states in the CNS
Ways to identify if microglia are activated
1. Counting
When activated, microglia undergo rapid proliferation. Therefore, a fairly crude way of identifying a population of activated microglia is purely by counting the number of microglial cells and comparing it with a non-activated population. If you decide to use the counting method, remember to randomize and blind your experiments. The downside of this technique is the lack of information regarding cytoarchitecture and protein expression.
2. Morphological Analysis
Since microglia exhibit unique morphologies based on their activation state, a reliable method to detect microglial activation is by quantifying their cytoarchitecture.
Sholl Analysis. One of the most common methods of quantifying microglial activation is by using the linear method of Sholl analysis. This method quantifies the number and complexity of branches in microglial cells through analysis of their radial distribution. To obtain this information, equidistant concentric rings are overlayed on a microglial cell with the central ring encompassing the cell body (Fig. 2). Process length is quantified by identifying the number of intersections within each circle. Sholl analysis can be automated using several programs; for example, ImageJ/FIJI offers a Sholl analysis plugin that can be utilized on z-stack images of microglia.
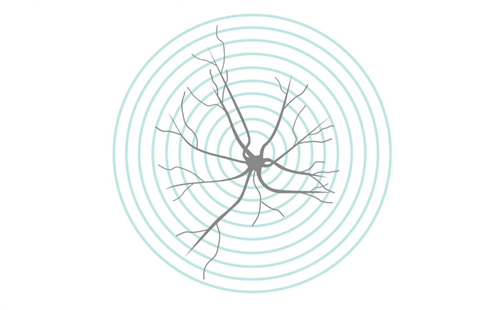
Fig. 2. Schematic of Sholl analysis
Skeletal Analysis. Another common method of quantifying microglial morphology is by skeletal analysis. This takes z-stacks labeling microglia and converts them to binary images and traces the cytoskeletal architecture of each cell (Fig. 3). Skeletal analysis can be automated through several programs. For example, ImageJ/FIJI offers a skeletal analysis plugin (Analyze Skeleton 2D/3D) that provides detailed information on your microglial population including process length, number of endpoints, and number of branches.
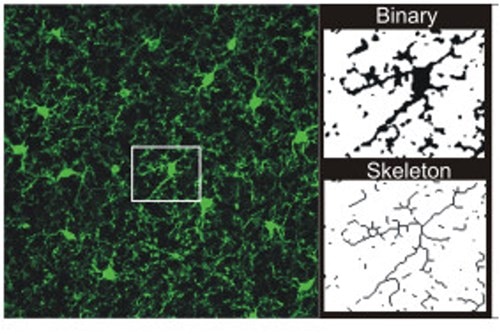
Fig. 3. Example of skeletal analysis. Image was obtained from Morrison & Filosa (2013) and used under CC BY2.0.
3. Microglial Markers
In order to perform microglial counts or morphological analysis as discussed above, cells need to be labeled with a microglia-specific marker. In addition, microglia-specific markers are key to verifying the quality of microglia isolation protocols. Microglia differentially express certain proteins when activated. Researchers can use these unique profiles to their advantage by identifying key activation markers in microglial populations. Microglial markers can be utilized for various techniques including IHC, WB, IF, and FC. Some common microglial-specific proteins and activation markers are listed below. Click here to see a full list of microglial cell markers. Some of these products are also available conjugated to fluorophores or as an IHCeasy kit!
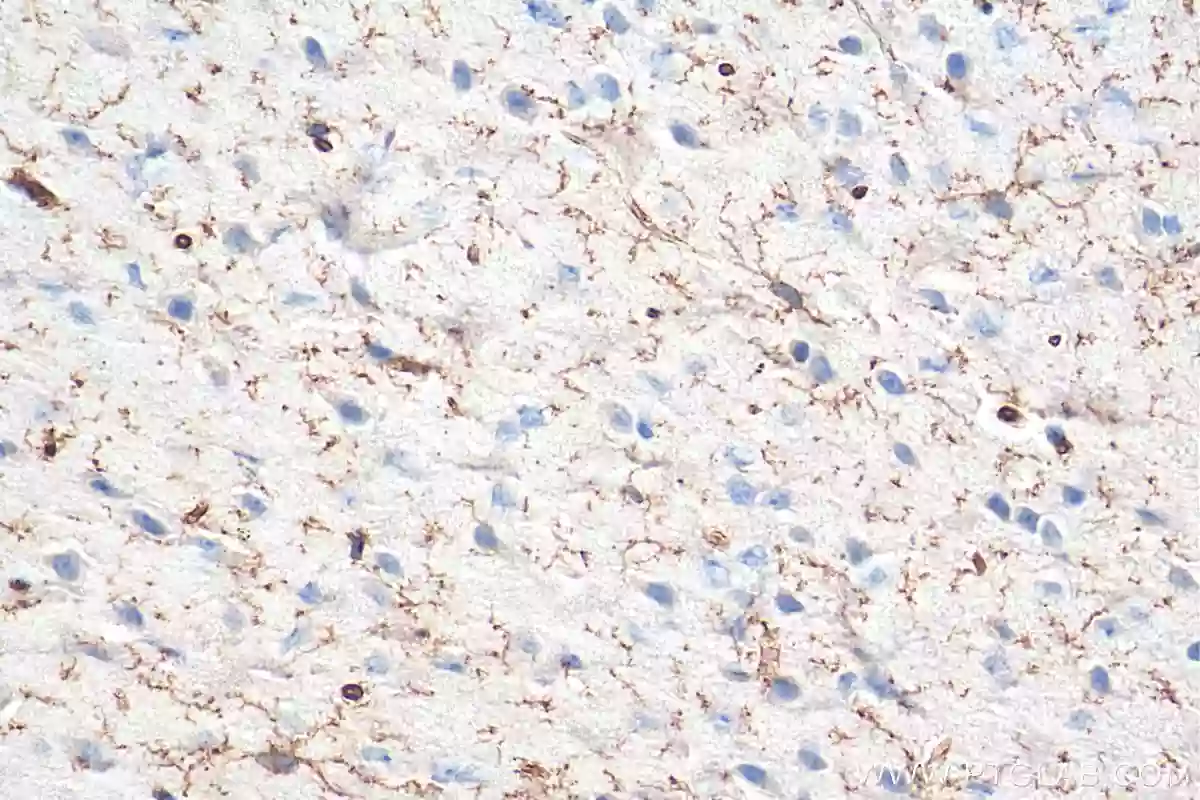
P2RY12
P2RY12 is a Gi-coupled purinergic receptor that is best known for its roles in platelet function, hemostasis, and thrombosis. P2RY12 is enriched on the surface of blood platelets. In the CNS, P2RY12 is found exclusively on microglia where it functions in microglia-dependent neuroprotection. Since P2RY12 is microglial-specific, it is becoming a widely used marker that can differentiate between microglia and infiltrating macrophages. Find our P2RY12 polyclonal antibody here.
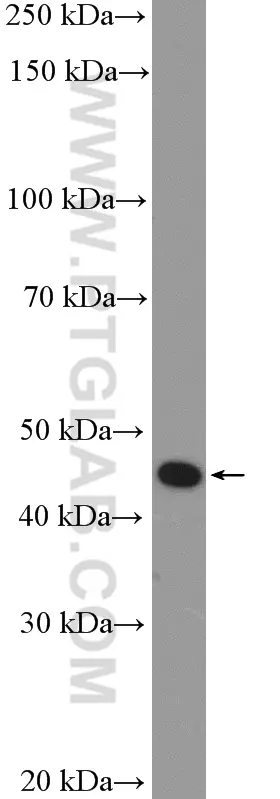
Fig. 4 Mouse spinal cord tissue was subjected to SDS PAGE followed by western blot with 11976-1-AP (P2RY12 Antibody) at dilution of 1:300 incubated at room temperature for 1.5 hours.
TMEM119
TMEM119 is a type I transmembrane protein that has been shown to play a role in osteoblast differentiation. In the CNS, TMEM119 is exclusively expressed on the surface of microglia and, similar to P2RY12, is a reliable marker to differentiate microglia from infiltrating macrophages. The exact biological role of TMEM119 in microglia is unknown. Explore our TMEM119 products here.
|
|
|
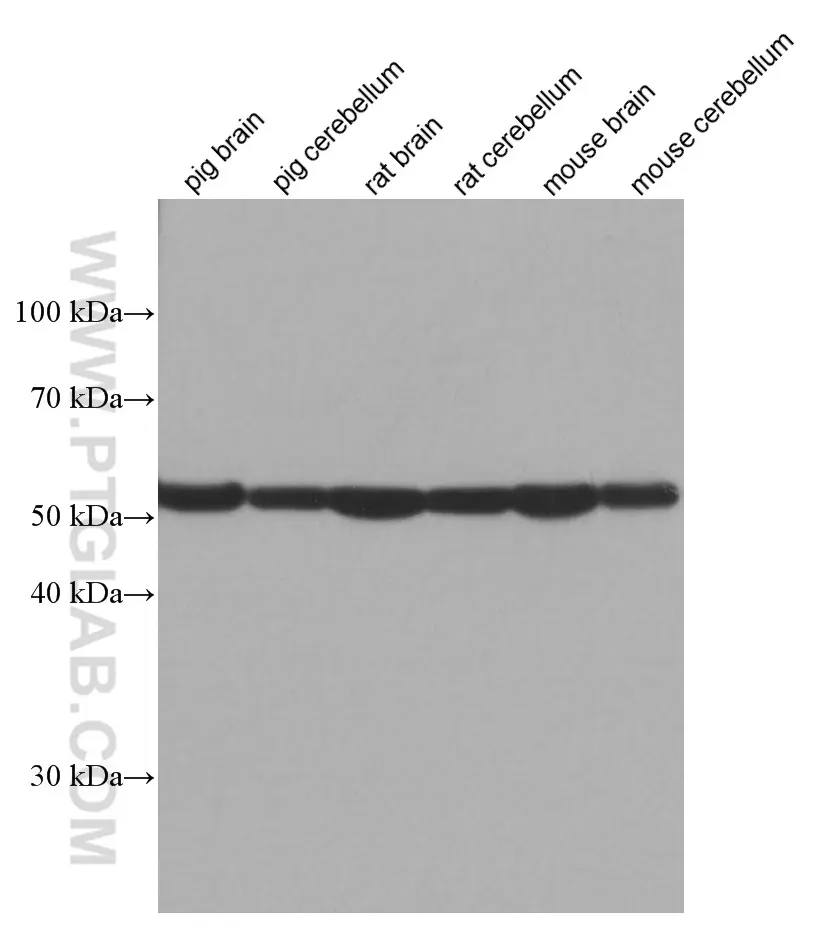
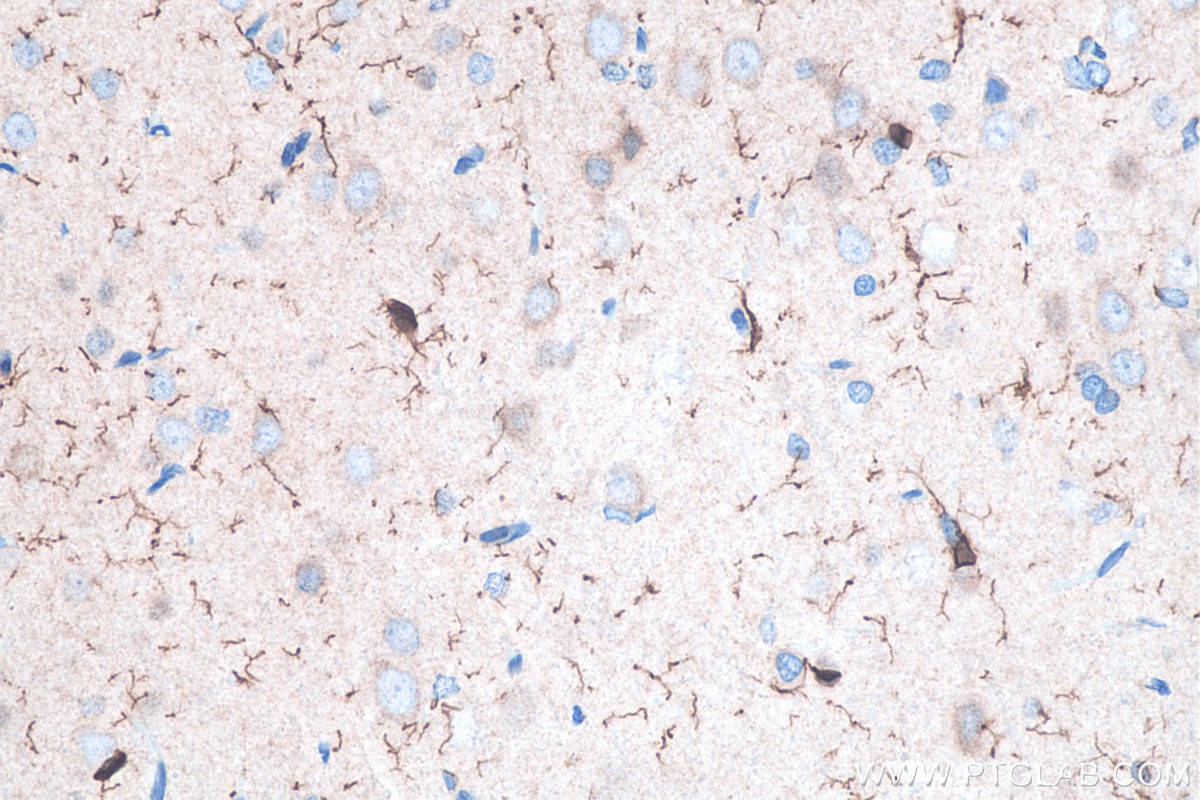
| Fig. 5. Immunohistochemical analysis of paraffin-embedded human brain tissue slide using 27585-1-AP (TMEM119 antibody) at dilution of 1:1000 (under 10x lens). Heat mediated antigen retrieval with Tris-EDTA buffer (pH 9.0). | Fig. 6. Various lysates were subjected to SDS PAGE followed by western blot with 66948-1-Ig (TMEM119 antibody) at dilution of 1:20000 incubated at room temperature for 1.5 hours. |
TREM2
TREM2 is a transmembrane receptor that is found in myeloid cells such as macrophages, granulocytes, monocytes, and dendritic cells. In the CNS, TREM2 is expressed only in microglial cells (unless there is infiltration of other myeloid cells). TREM2 plays a key role in microglia homeostasis and inflammatory response to pathogens and CNS damage. Explore our TREM2 products here.
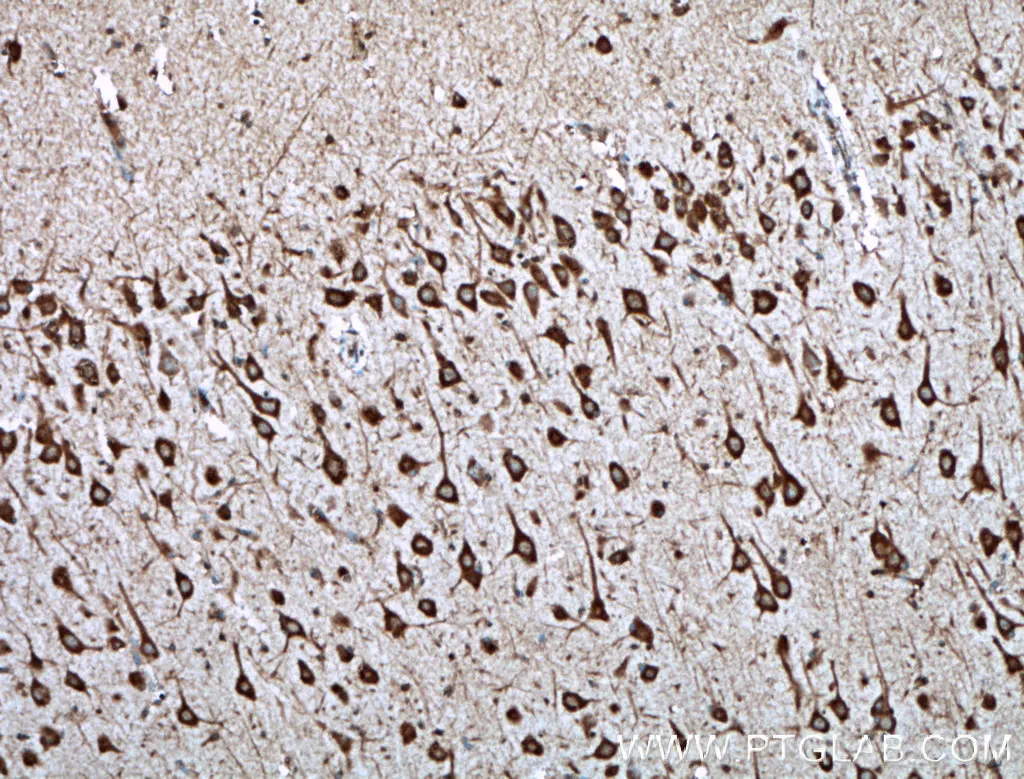
Fig. 7. Immunohistochemical analysis of paraffin-embedded human brain tissue slide using 27599-1-AP (TREM2 antibody) at dilution of 1:200 (under 10x lens). Heat mediated antigen retrieval with Tris-EDTA buffer (pH 9.0).
AIF1/Iba1
AIF1/Iba1 is a cytoplasmic calcium-binding protein that is expressed in cells of monocytic lineage. In the CNS, AIF1/Iba1 is expressed in microglial cells but can also be expressed in circulating macrophages and is upregulated during microglia/macrophage activation. AIF1/Iba1 has been shown to play roles in the growth and proliferation of smooth muscle and endothelial cells. Additionally, AIF1/Iba1 participates in membrane ruffling and phagocytosis in activated microglia. Explore our AIF1/Iba1 products here.
 |
 |
|
Fig. 8. Immunohistochemical analysis of paraffin-embedded rat brain tissue slide using KHC0056 (IBA1 IHC Kit). |
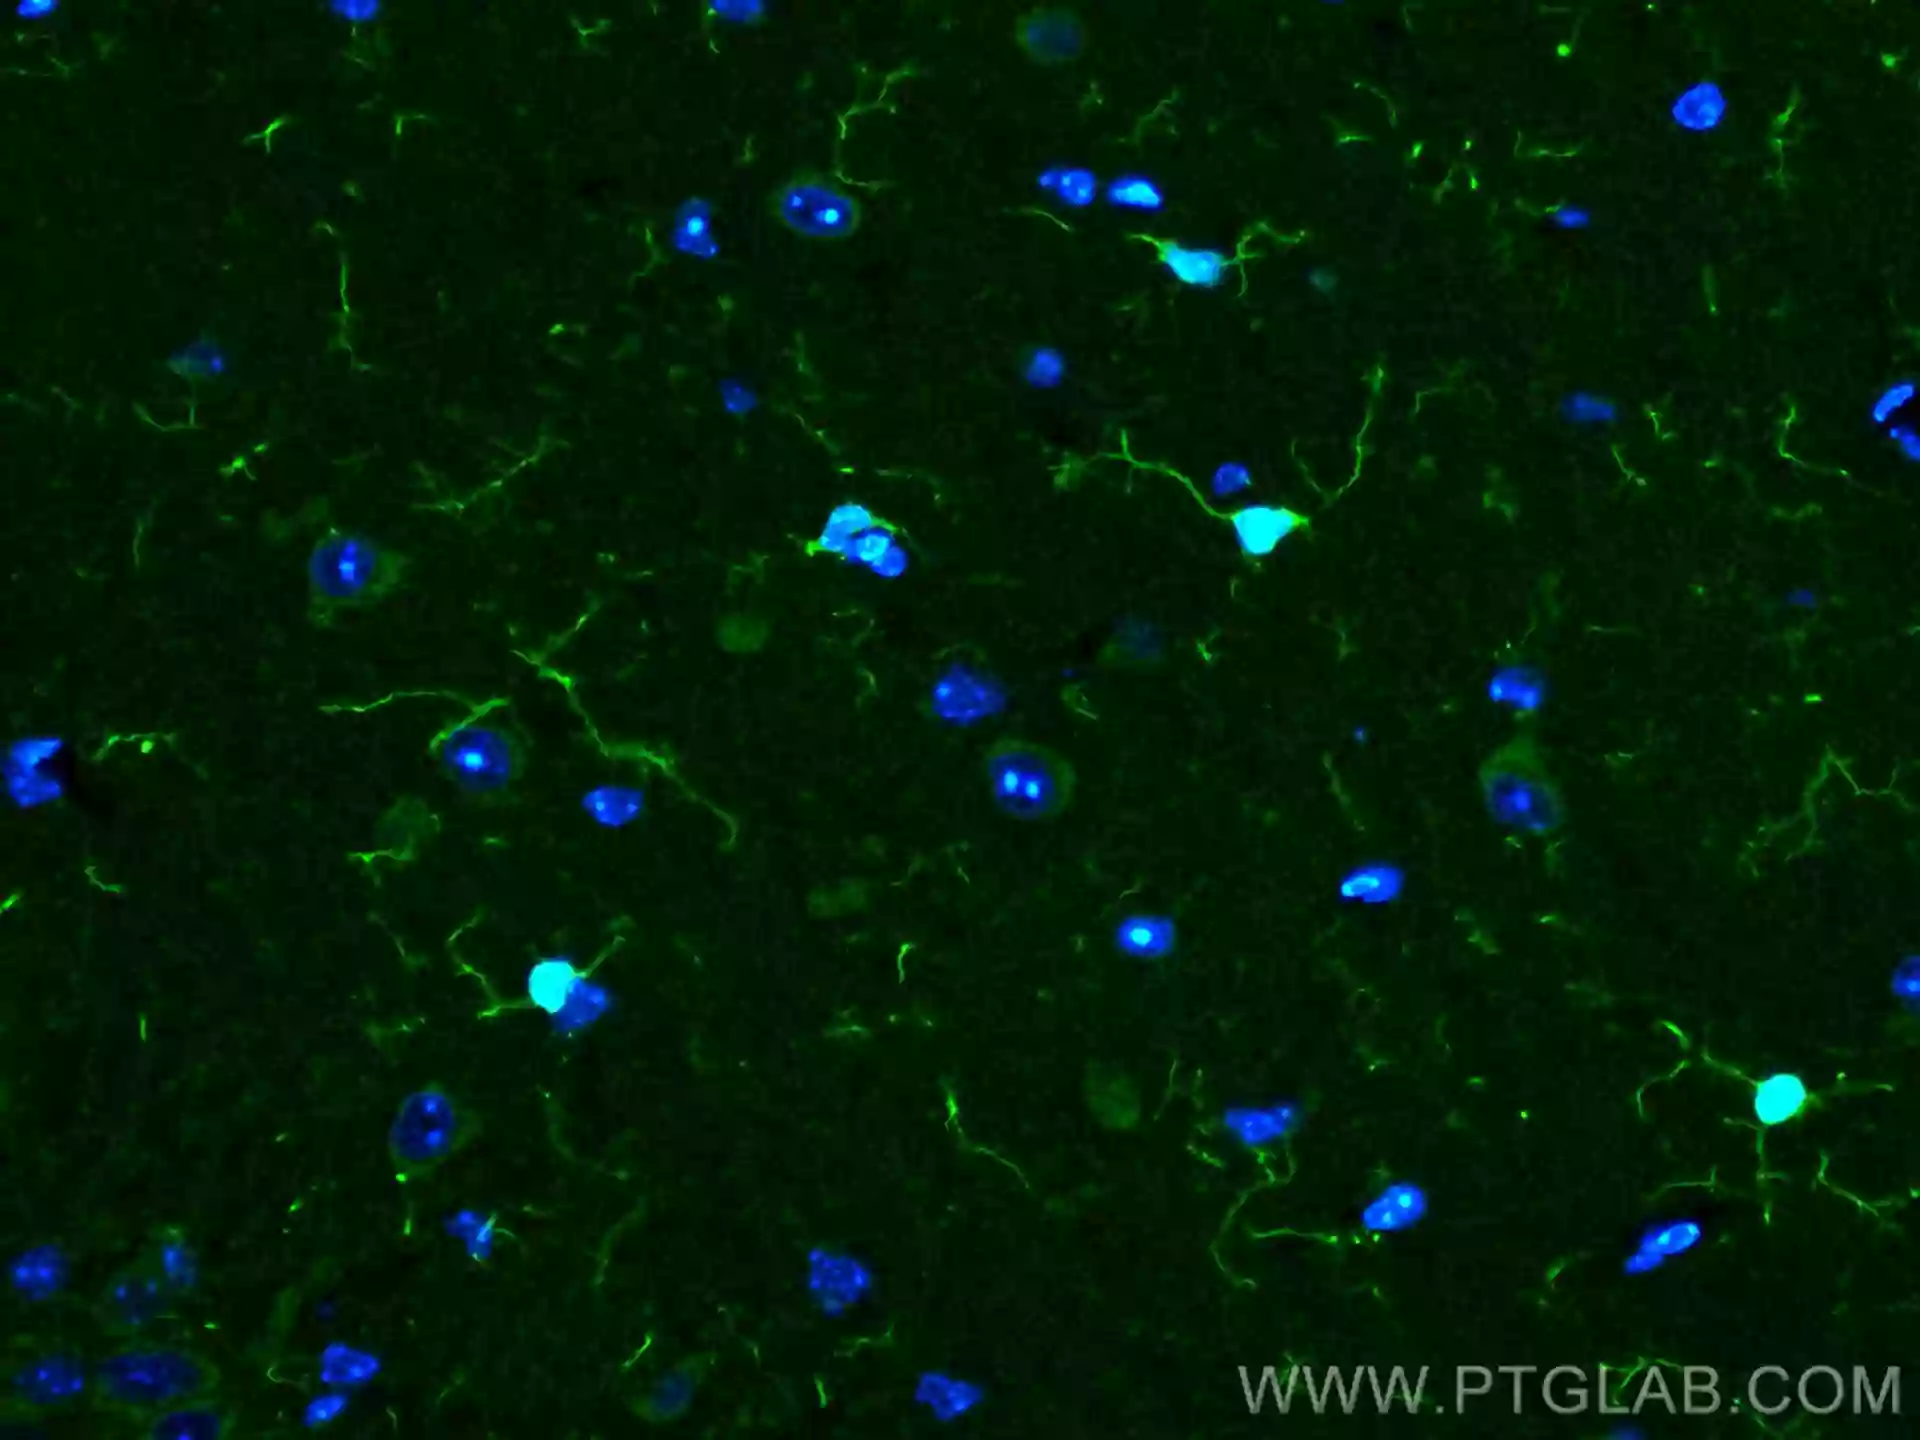
Fig. 9. Immunofluorescent analysis of (4% PFA) fixed rat brain tissue using 10904-1-AP (IBA1 antibody) at dilution of 1:100 and CoraLite488-Conjugated AffiniPure Goat Anti-Rabbit IgG(H+L). |
CD11b
CD11b is an adhesion molecule expressed in several immune cell types including monocytes, granulocytes, macrophages, dendritic cells, and natural killer cells. In the CNS, CD11b is expressed in microglia and its expression increases with microglial activation. CD11b is best known for playing roles in cellular adhesion and spreading. Explore our CD11b products here.
 |
 |
|
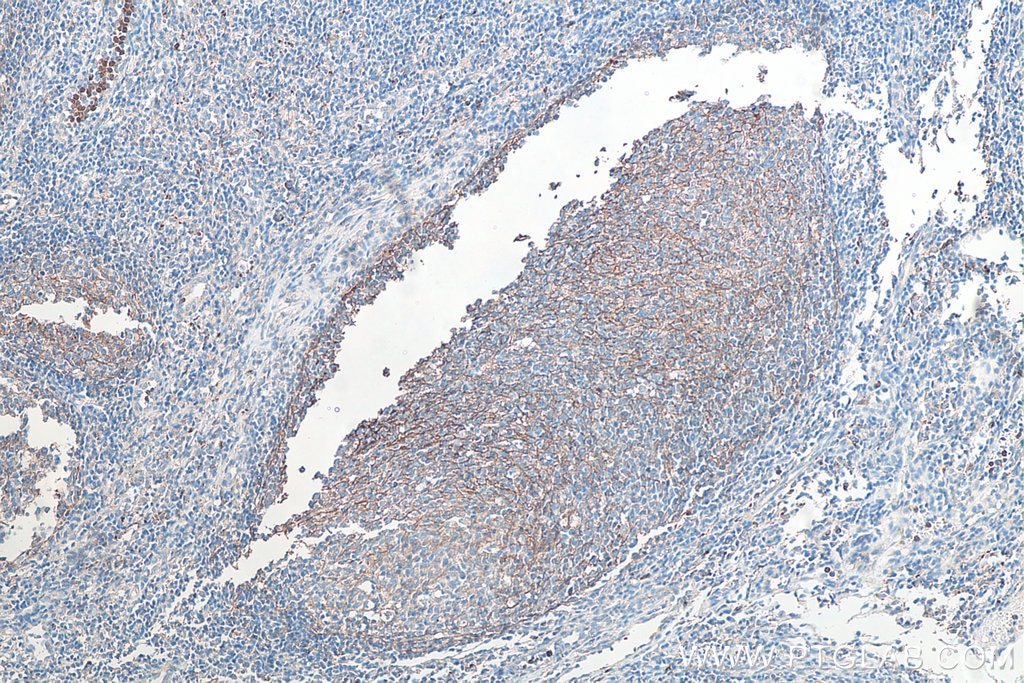
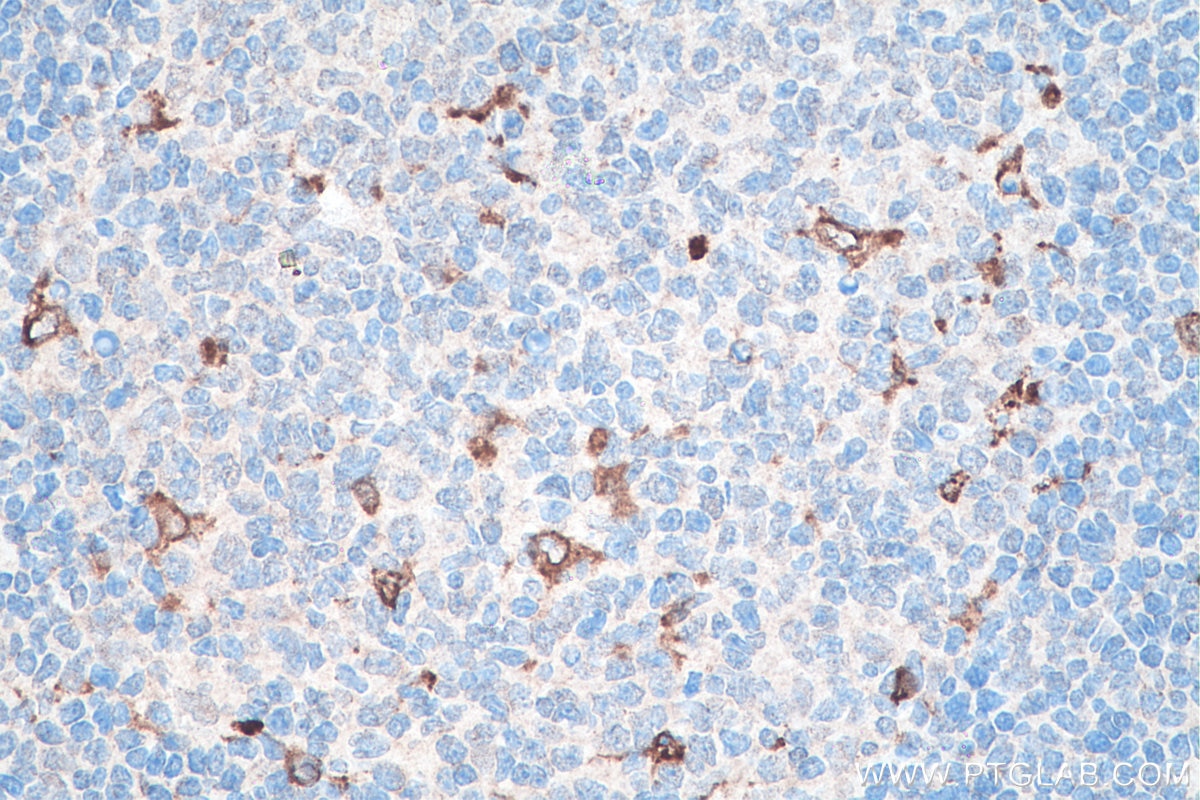
Fig. 10. Immunohistochemical analysis of paraffin-embedded human tonsillitis tissue slide using KHC0027 (CD11B IHC Kit). |
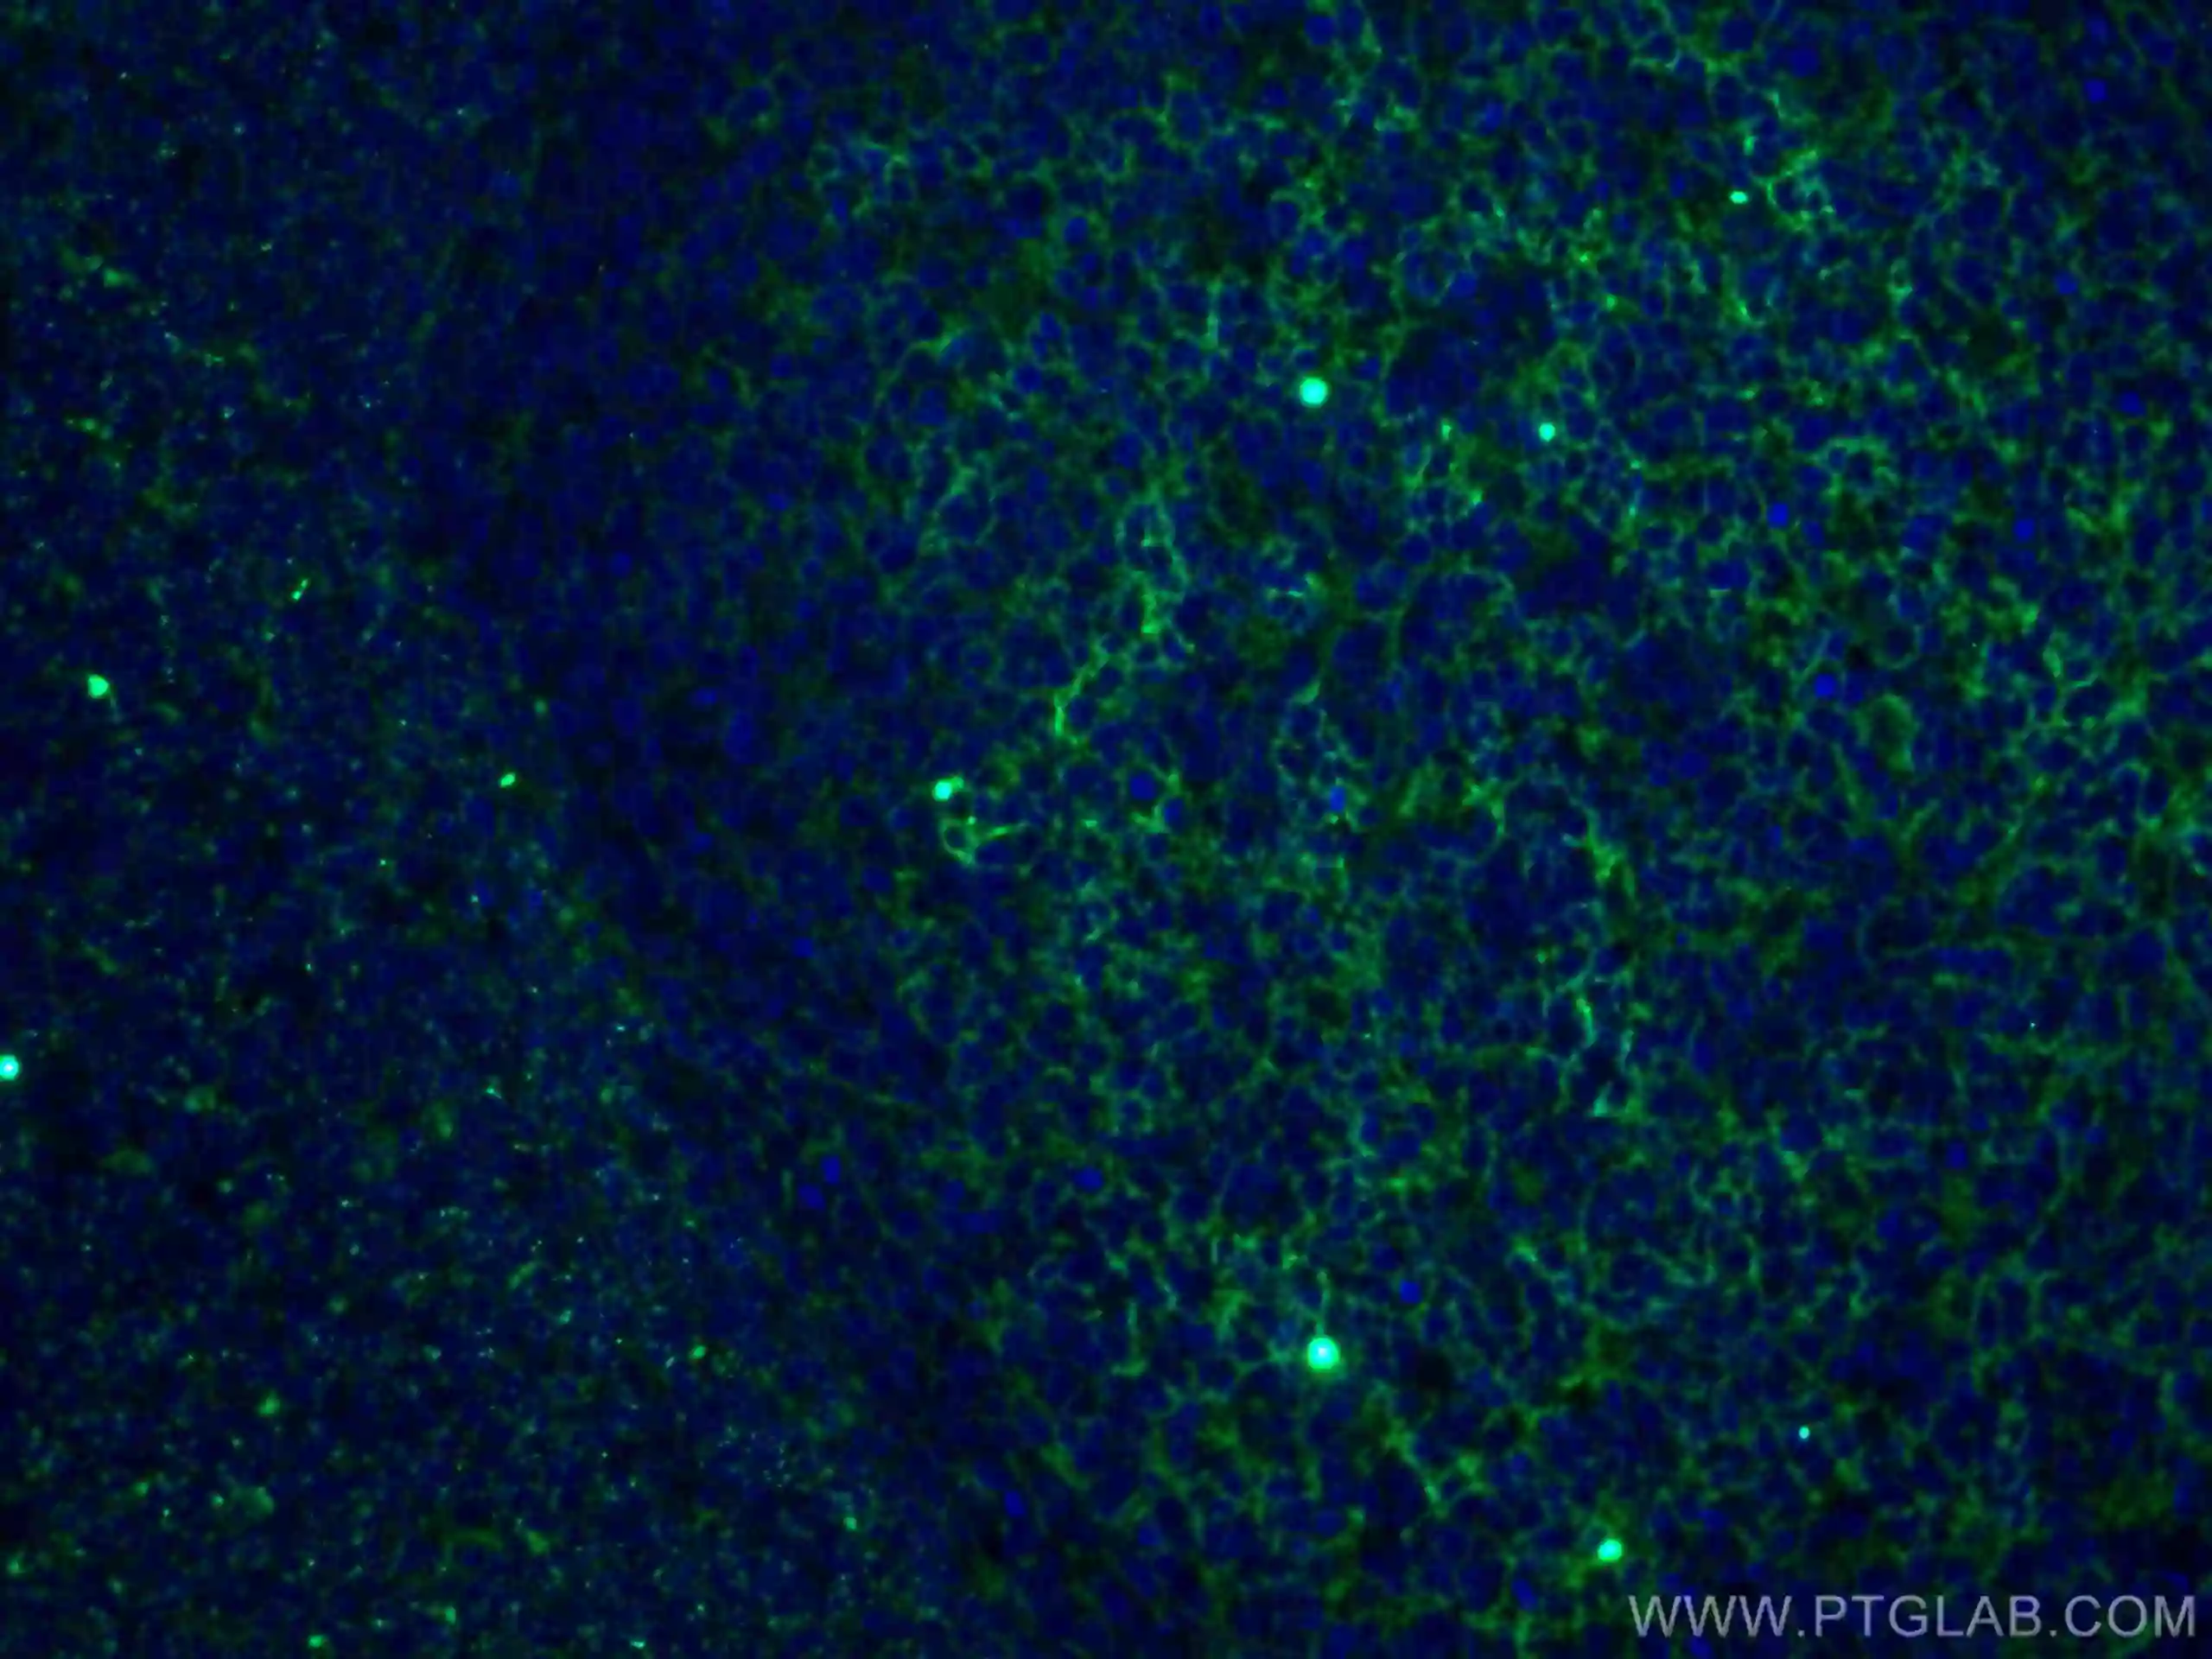
Fig. 11. Immunofluorescent analysis of (4% PFA) fixed human tonsillitis tissue using 66519-1-Ig (CD11B/Integrin alpha M antibody) at dilution of 1:100 and CoraLite488-Conjugated AffiniPure Goat Anti-Mouse IgG(H+L). |
CD68
CD68 is a heavily glycosylated protein found in cells of myeloid lineage, including macrophages, dendritic cells, mast cells, neutrophils, and basophils. In the CNS, CD68 is expressed in microglia and its expression increases with microglial activation. CD68 is generally found within the late endosomal compartment where it is thought to play a role in membrane integrity and antigen processing. Due to its cellular localization and change in expression during microglial activation, CD68 is a reliable marker to identify phagocytic microglia. Explore our CD68 products here.
 |
 |
|
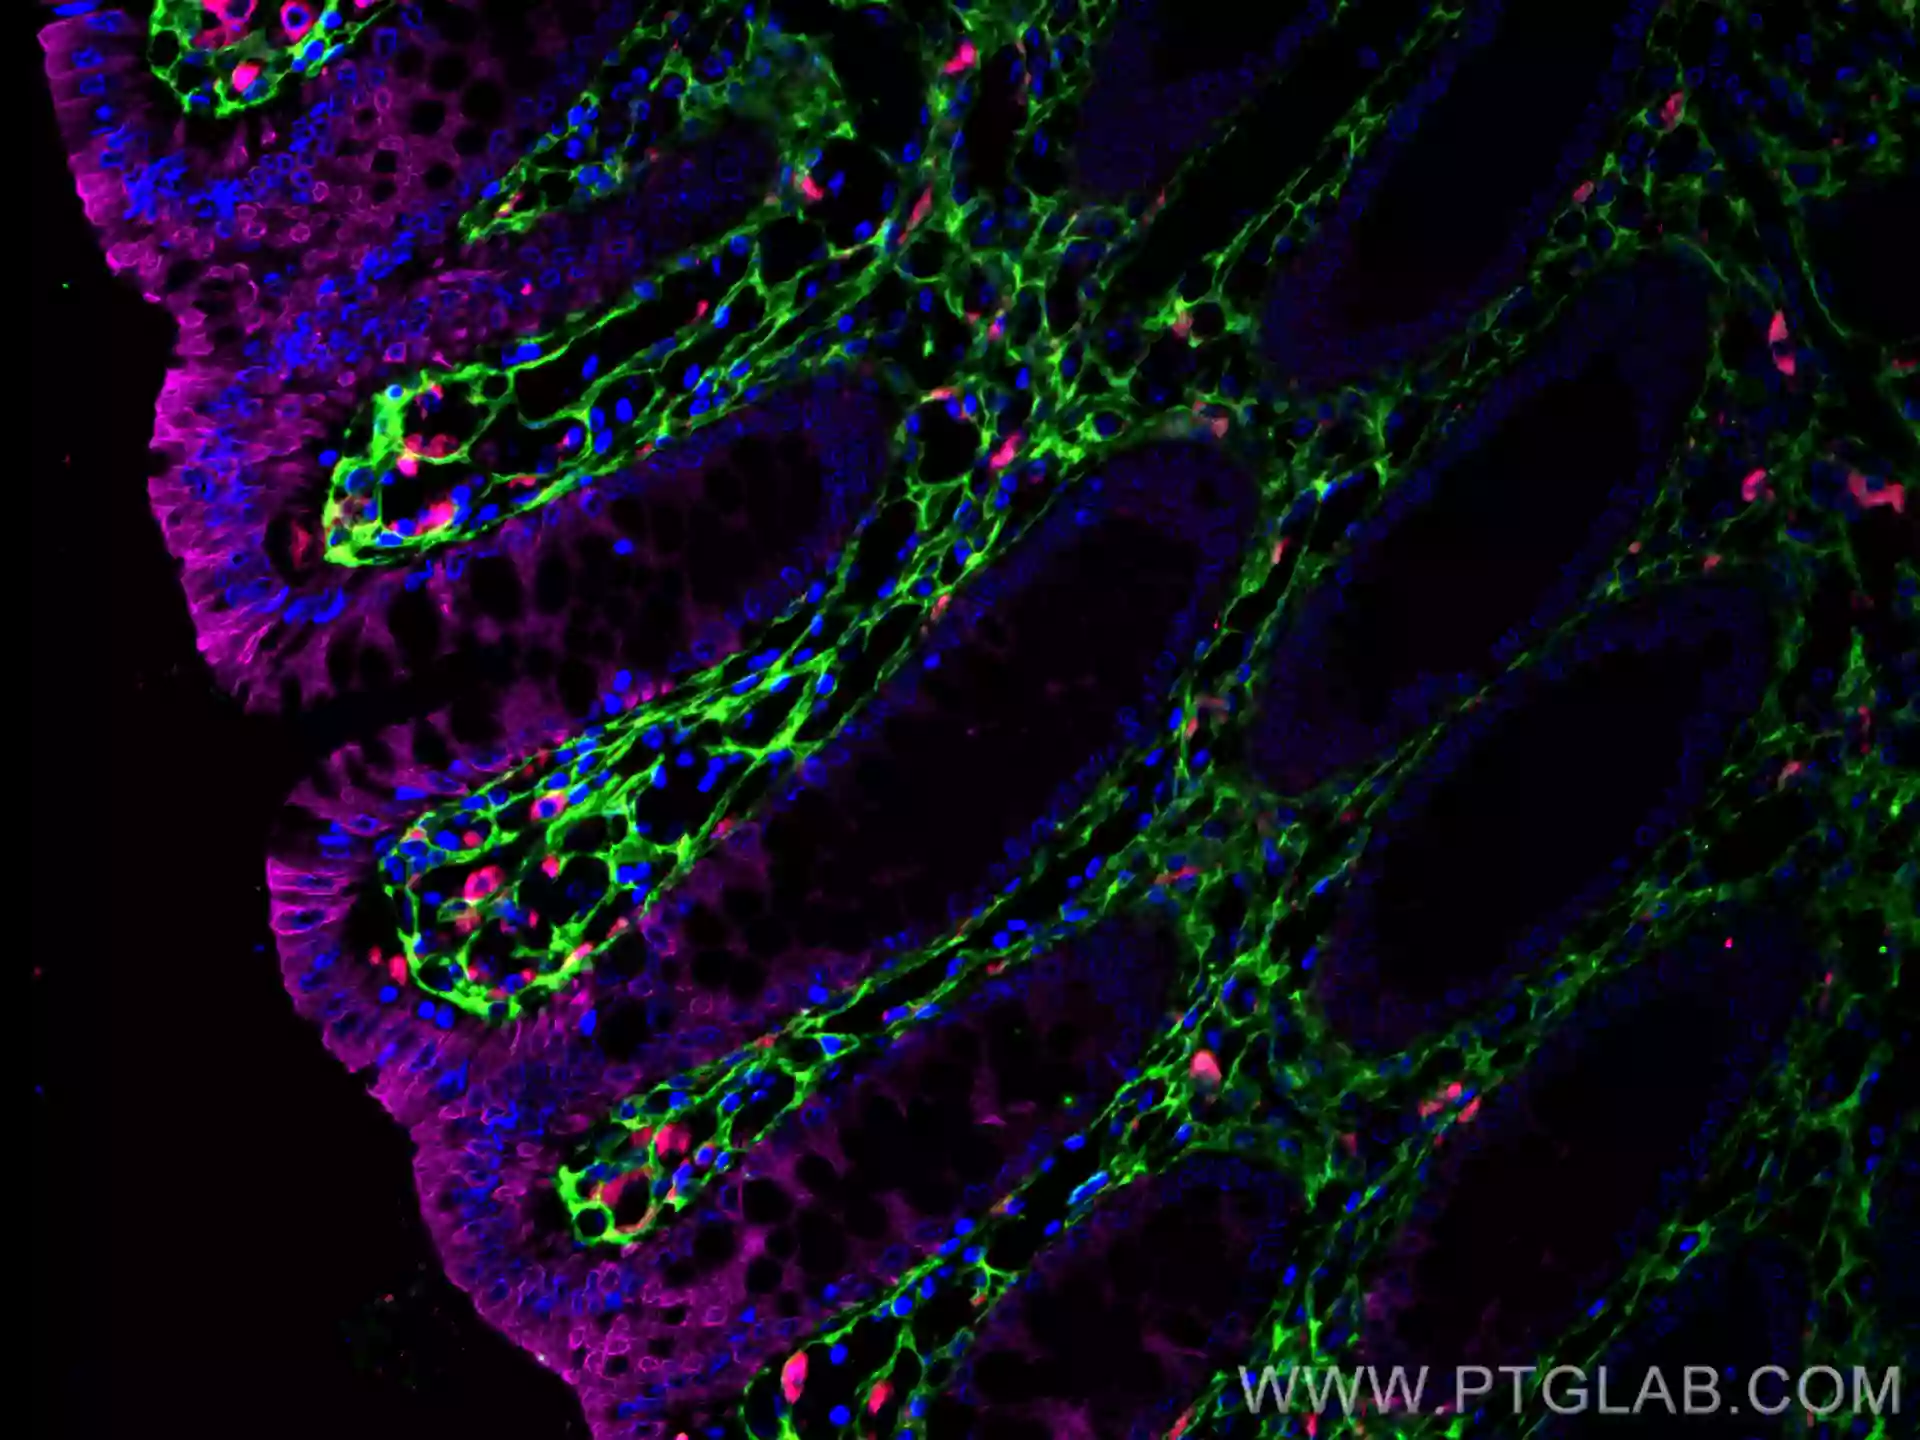
Fig. 12. Immunofluorescent analysis of (4% PFA) fixed human colon tissue using CoraLite®594 CD68 antibody (CL594-25747) at dilution of 1:200, CoraLite®488 Cytokeratin 20 antibody (CL488-60183, Clone: 4D10A4, green), Collagen Type III (N-terminal) antibody (22734-1-AP, Magenta). |
Fig. 13. Immunohistochemical analysis of paraffin-embedded human tonsillitis tissue slide using KHC0006 (CD68 IHC Kit). |
The best way to identify microglial activation is based on your research question. However, we recommend carrying out a combination of the techniques discussed here in order to validate your data.
References:
Cătălin, B., Alexandru, D., Albu, C. A. R. M. E. N., & Iancău, M. A. R. I. A. (2013). Microglia branching using a Sholl analysis method. Curr Health Sci J, 39(Suppl 4), 1-5.
Jurga, A. M., Paleczna, M., & Kuter, K. Z. (2020). Overview of general and discriminating markers of differential microglia phenotypes. Frontiers in cellular neuroscience, 14, 198.
Morrison, H. W., & Filosa, J. A. (2013). A quantitative spatiotemporal analysis of microglia morphology during ischemic stroke and reperfusion. Journal of neuroinflammation, 10(1), 1-20.
Prinz, M., Masuda, T., Wheeler, M. A., & Quintana, F. J. (2021). Microglia and central nervous system–associated macrophages—from origin to disease modulation. Annual review of immunology, 39, 251-277.
Young, K., & Morrison, H. (2018). Quantifying microglia morphology from photomicrographs of immunohistochemistry prepared tissue using ImageJ. JoVE (Journal of Visualized Experiments), (136), e57648.

Related Content
Imaging the Rainbow: Multiplexing with Same-Species Antibodies for Immunofluorescence
Gut Microbiome-Brain Axis: Early Career Researcher Meeting 2022
CoraLite Plus Fluorescent-dye Conjugated Antibodies
Support
Newsletter Signup
Stay up-to-date with our latest news and events. New to Proteintech? Get 10% off your first order when you sign up.
Able™